Non-Linear production with Learning
This example deals with the impact of the learning effect by illustrating:
Production-based relationships: How workers productivity is affected.
Cost curves: How the learning effect affects the cost S-curves.
Resource consumption: How the learning effect affects resource consumption, mainly manpower and machinery vs materials.
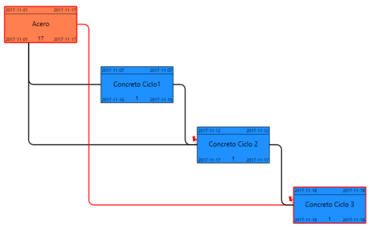
This project involves scheduling the concrete pouring for a foundation slab, which will occur in three distinct cycles (blue activities in Figure 1). The scheduling logic incorporates Start-to-Start (SSij) dependencies, contingent upon achieving specific production milestones in steel assembly, in two ways, the first considering traditional activities (Solution_traditional file), and with activities of sub-activities (Solution_Plexos file).

The learning curve, often termed the "efficiency curve" or "productivity curve," reflects the natural phenomenon that workers require time to master a specific task and subsequently enhance their efficiency in its execution. Plexos employs the following equation to model this learning:
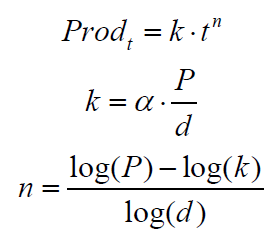

Where:
P represents the total production for the activity.
d is the duration of the activity.
t is a period from 1 to d.
α is a discretionary parameter used to adjust the intensity of learning.
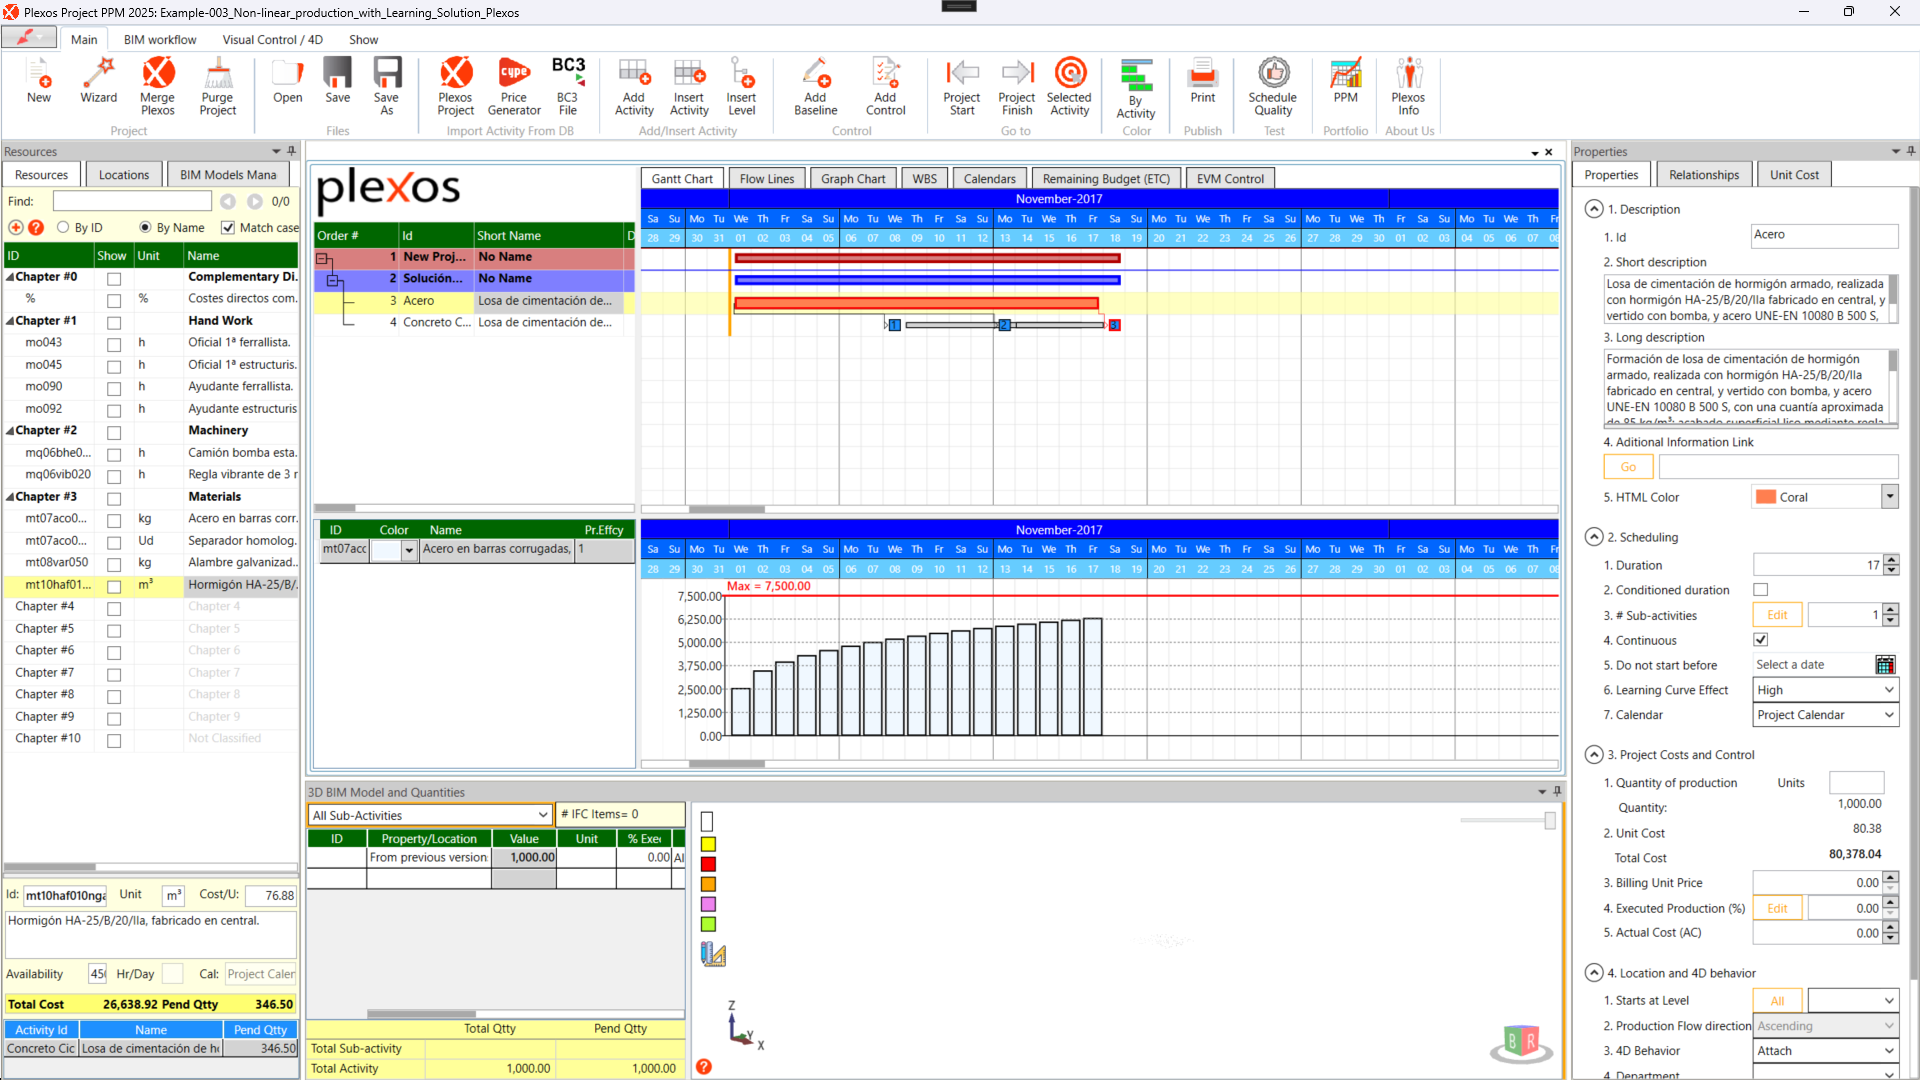
Changing the "Learning Curve Effect" of the Steel activity ("Acero") on the properties panel, the start of the activities "Ciclo Concreto 1" and "Ciclo Concreto 2" are adjusted until the required production level of steel assembly is achieved (Figures 2 and 3).
The learning effect delays the starting of activities by a Start-to-Start (SSij) relationship and brings forward the finishing by Finish-to-Finish (FFij) relationships. Consequently, the histograms of resources and cost change according to the distribution of the resources.
While the learning effect influences resource consumption, its impact varies. Manpower and Machinery exhibit consistent resource consumption, regardless of efficiency improvements. Conversely, resources like Materials demonstrate a decrease in consumption as the efficiency of Manpower and Machinery increases over time.
The following images illustrate this concept using "Steel" as an example. Steel consumption is modeled with learning curves, but these curves are dynamically adjusted to reflect the evolving efficiency of manpower (Figures 2 and 3).
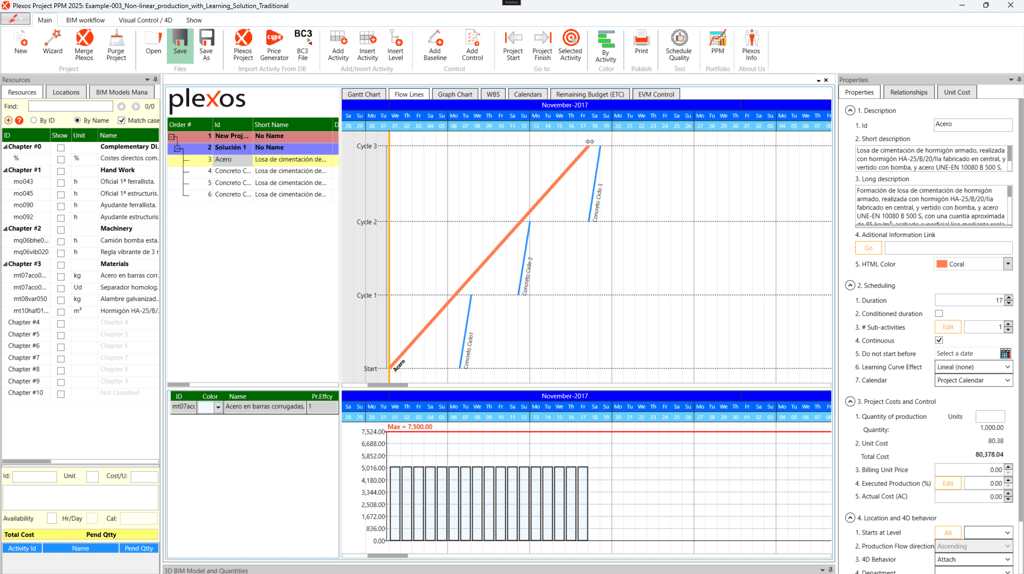

Figure 2. Curve Effect: Lineal
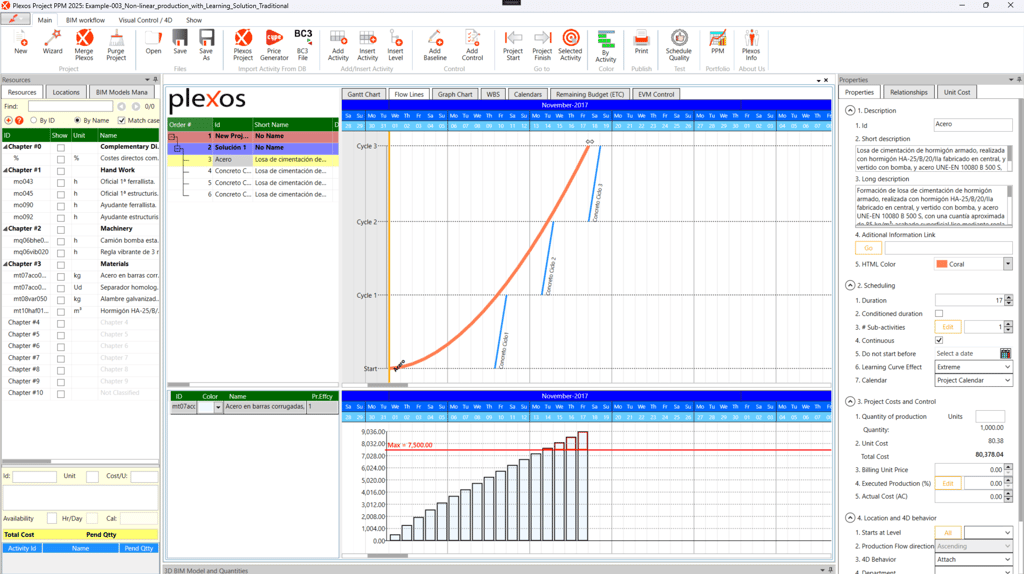

Figure 3. Curve Effect: Extreme
Figure 1. Example graph for 4 activities