Earned Value Management
This article exposes some budgeting and Earned Value Management (EVM) foundations, and their practical application within Plexos, highlighting important considerations for accurately interpreting the results.
Basics of Project Budgeting
Updated Quantity (UQ)
The Updated Quantity (UQ), estimated at each control point (t), represents the revised production output expected for the project.
Updated Unit Cost (UC).
The Updated Unit Cost (UC), represents the estimated cost per unit at the current control point (t).


Figure 5. Updated Unit Cost (UC) in EVM Panel
Percent executed (ex).
The Percent Executed (ex) is the production advance, expressed in percent over the Updated Quantity (UQ).
Planned Value (PV)
Planned Value (PV), also known as Baseline or Budgeted Cost of Work Scheduled (BCWS), represents the value of the cumulated planned work to be performed up to a specific point in time according to the project schedule and budget.
Planned Unit Cost (PC).
The Planned Unit Cost (PC) represents the estimated cost per work unit before starting the project.

Figure 4. Planned Unit Cost (PC) in EVM Panel
Figure 2. Updated Quantity (UQ) in EVM Panel
Planned Quantity (PQ)
The Planned Quantity (PQ), represents the estimated output expected from the project before its commencement. This value is established during the baseline creation process, and extracted directly from the current property values within the system.
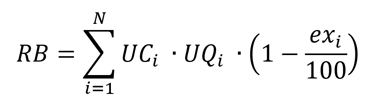
Remaining Budget (RB) or Estimate to Complete (ETC).
The Remaining Budget (RB), also known as Estimate to Complete (ETC), represents the project costs pending to be expended. This value is calculated considering the updated production quantity, the percentage of production completed, and the updated unit cost for each activity.
When a new baseline is added to the project, Plexos uses the Remaining Budget to build the Planned Value of the project, based on the current schedule, quantities, and costs of the project activities.
Before creating the baseline, the Updated Quantity (UQ) is equal to the Planned Quantity (PQ).

Figure 3. Percent executed (ex) in EVM Panel

Basics of Earned Value Management (EVM)
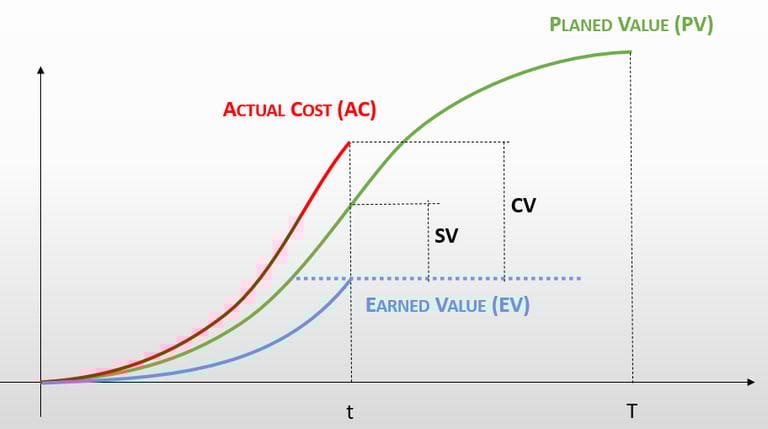

Figure 6. EVM Main Values
Actual cost (AC)
The Actual Cost (AC) is the total cost that is actually incurred for the work actually performed for each of the tasks of the project until the period of control.
Earned Value (EV)
The Earned Value (EV) or Budgeted Cost of Work Performed (BCWP) quantifies the planned value of the work completed at a specific point in a project. It's calculated by multiplying the budgeted cost of the work scheduled to be completed at that point by the percentage of work actually performed.
Actual Cost plus Remaining Budget
The Actual Cost plus the Remaining Budget (AC+RB) or Estimated At Completion (EAC) represents the anticipated total project cost, calculated by summing the Actual Cost incurred to date with the Remaining Budget estimated using updated unit costs and production quantities for all remaining project activities.
Schedule variation (SV).
The Schedule Variation (SV) measures the difference between the Planned Value (PV) and the Actual Cost (AC) at a specific point in time. It indicates the project's progress in terms of budgeted costs.
Schedule Variance (SV) can result in two distinct scenarios:
Positive SV: Indicates the project, activity, or chapter is ahead of schedule.
Negative SV: Signifies the project, activity, or chapter is behind schedule and experiencing delays.
The Earned Value performance values
Earned Value Management (EVM) lies on three core metrics: Planned Value (PV), the forecasted cost of work scheduled to be performed, Actual Cost (AC), the actual cost incurred to date, and Earned Value (EV), the value of the work completed to date.
While PV and AC represent the planned and actual expenditure, respectively, EV serves as the cornerstone of EVM. It quantifies the value of work accomplished based on the project schedule, enabling the calculation of key performance indicators like Schedule Variance (SV) and Cost Variance (CV), which measure the project's progress against its planned schedule and budget.
Cost variation (CV).
The Cost variation (CV) measures how closely the actual project costs align with the planned budget at a given control point (t). It's calculated as the difference between the Earned Value (EV) at time (t) and the Actual Cost (AC) at time (t).
The CV can have two outcomes:
Positive CV: Indicates the project is under budget. The earned value exceeds the actual cost.
Negative CV: Indicates the project is over budget. The actual cost exceeds the earned value.
When CV is negative, the project, activity, or work package is experiencing a cost overrun, meaning the actual costs have exceeded the planned budget.
Schedule Performance Index (SPI) and Cost Performance Index (CPI)
The Schedule Performance Index (SPI) and the Cost Performance Index (CPI) are normalized measures of project performance, providing a ratio of Earned Value to Planned Value (for SPI) and Earned Value to Actual Cost (for CPI). In contrast to Schedule Variance (SV) and Cost Variance (CV), which represent the difference between earned value and planned/actual cost, SPI and CPI express performance as a ratio, facilitating easier comparison and trend analysis.
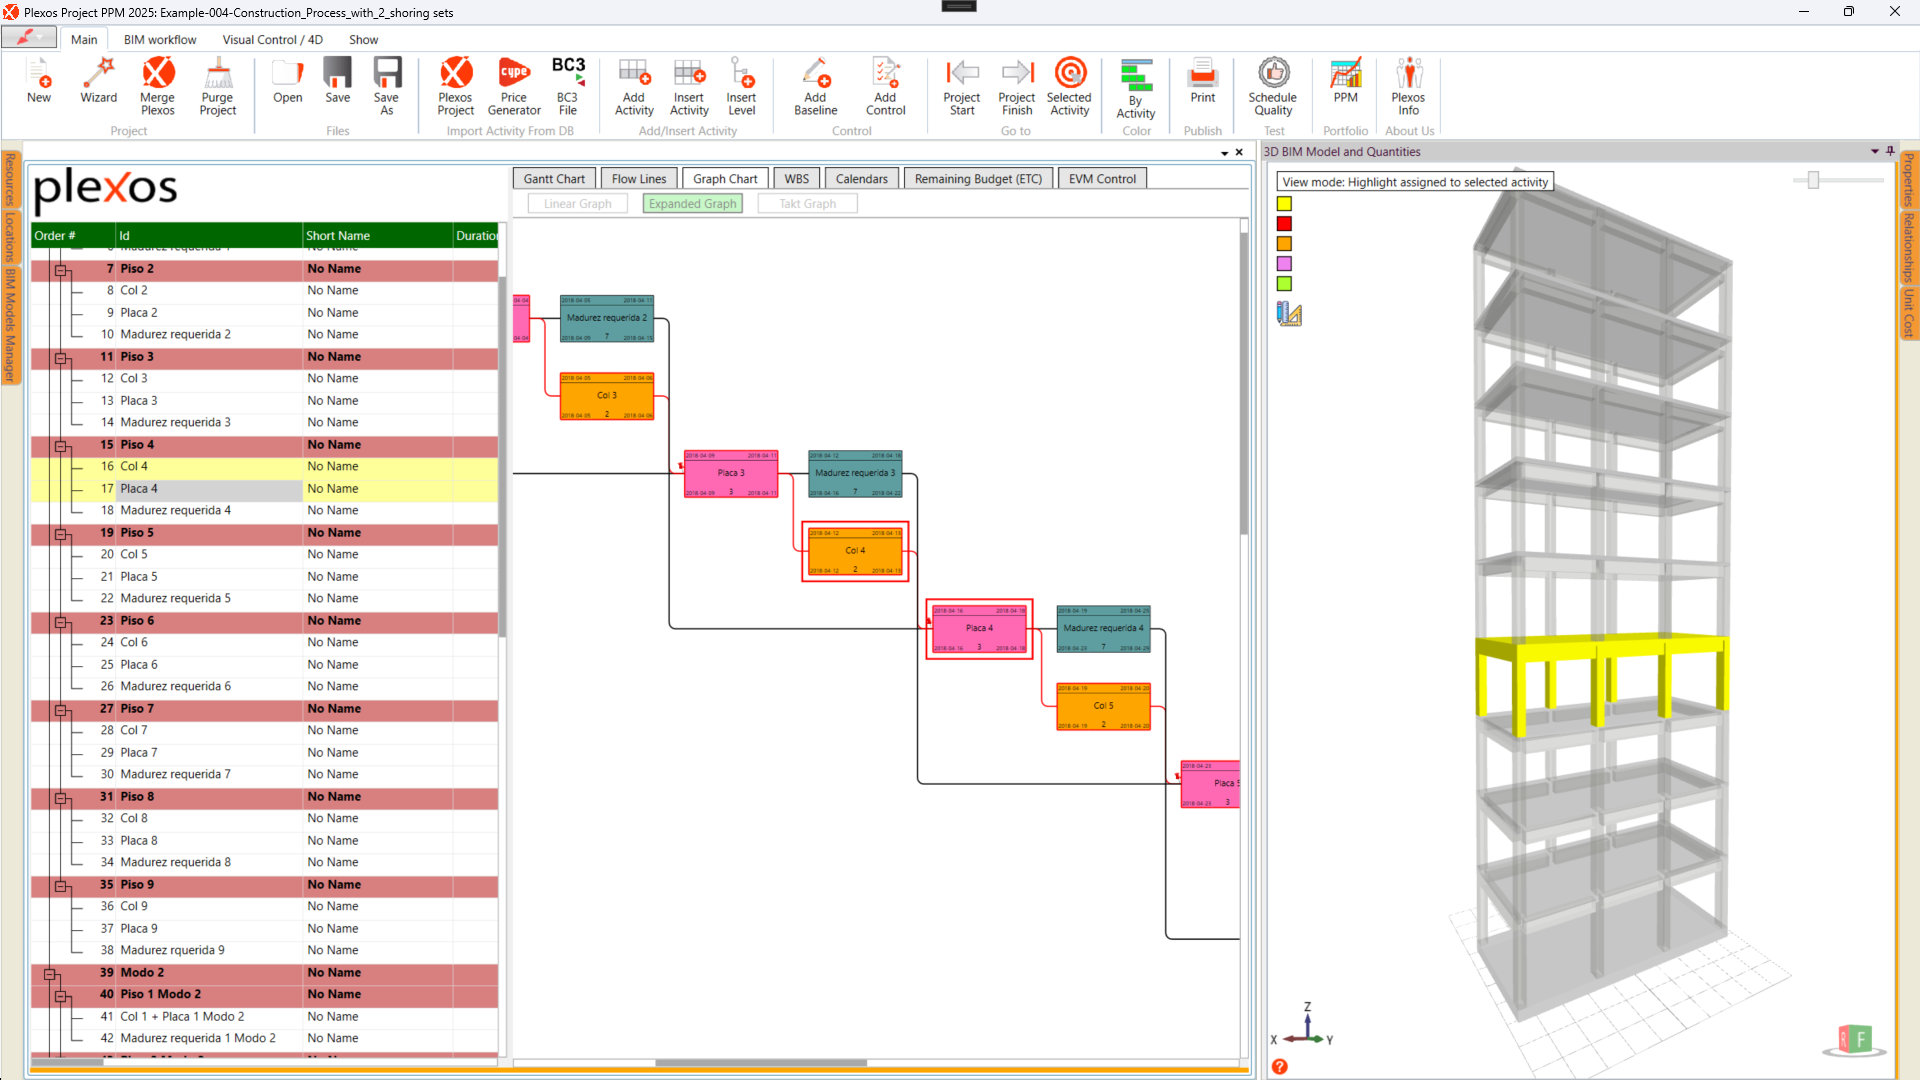
For a complete understanding of the previously exposed budgeting and Earned Value Management (EVM) concepts, this section presents a conceptual application example utilizing Plexos, demonstrating the principles of EVM, the process for its proper implementation, and crucial considerations for accurate result interpretation.
The project consists of 10 activities, structured with one critical path (highlighted in orange), two non-critical paths (highlighted in blue), two initial activities, and one final activity.
Example of application with Plexos
The Planned durations, Quantities and Unit Costs for the activities are exposed below.

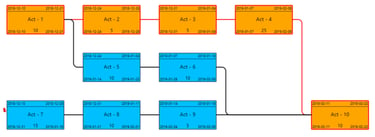
Figure 7. Project Planned Graph
Project baselines are created by clicking the 'Baseline' button on the ribbon and assigning a name.
A project baseline captures the initial planned schedule, cost, and resource allocations at a specific point in time. Think of it as a snapshot of the project – a benchmark for tracking progress and evaluating performance against the original plan.
Multiple baselines can be created to represent different scenarios or "what-if" analyses, empowering informed decision-making throughout the project lifecycle.
In the Gantt chart, the current schedule can be visually compared with a baseline. The gray bars represent the baseline schedule, providing a clear visual contrast to the colored bars indicating the current schedule.
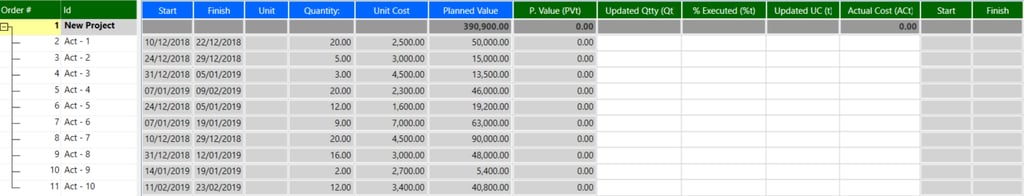
Figure 8. Project Planned Values
Control 1. 14/12/2018
In the first control, activity Act-1 commenced two days behind schedule on December 12th, while Act-7 began on December 10th. The duration of Act-7 was revised from 15 days to 14 days.
Earned Value Management (EVM) analysis should be conducted at multiple levels, including the project level, the chapter level, and the level of critical activities. While project-level analysis provides an overall view, a deeper understanding of project delays requires analyzing critical activity evolution, particularly focusing on Schedule Variance (SV) to pinpoint the true sources of delays.
At the project level, a Schedule Variance (SV) of -4,000 economic units (EU) is observed. However, a more critical concern arises from Act-1, which exhibits an SV of -10,000 EU, directly indicating the project's actual delay. Furthermore, the project is experiencing a cost overrun of 8,000 EU based on the executed production.
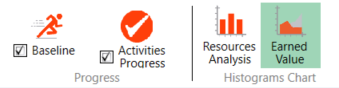
To view these features in the Gantt chart, check the Baseline, Activity Progress, and Earned Value options.
To demonstrate this process, the project example incorporates six control points.
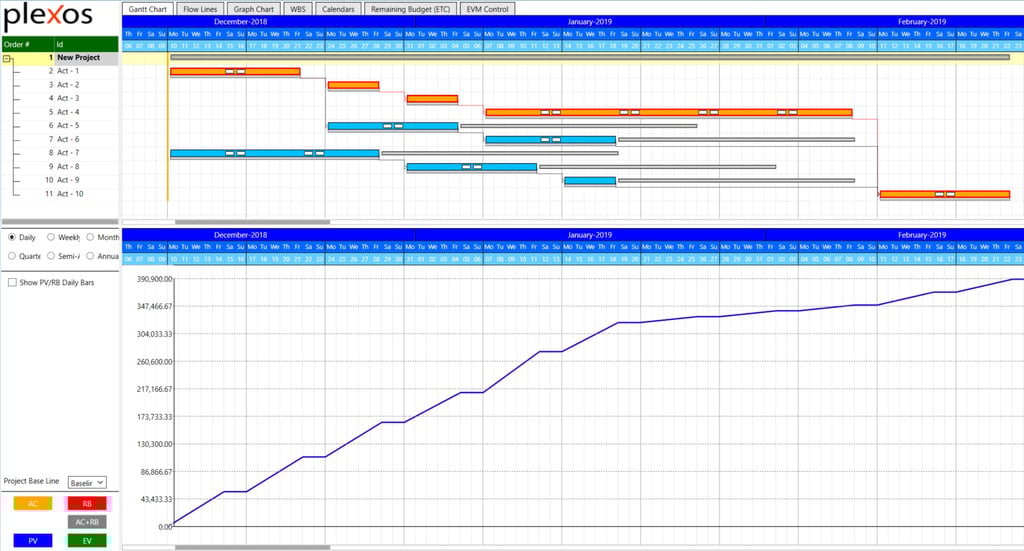

Figure 9. Baseline and Planned Value

Control 2. 21/12/2018
This control highlights a significant issue: analyzing Schedule Variance (SV) only at the project level can lead to wrong conclusions. While the overall project exhibits a positive SV of 3,500 EU, a deeper analysis reveals a critical delay in Act-1 with an SV of -17,500 EU. This indicates that the positive project-level SV is primarily driven by the significant positive variance in Act-7 (21,000 EU), masking the critical delay in Act-1. Essentially, we are working hard but not effectively addressing the most critical area of delay.
On the other hand, the Cost Variance (CV) presents a positive value of 11,500 EU, signifying a cost reduction in the current production phase.


Figure 11. Control 1
Figure 10. Progress Visualizations
Control 3. 28/12/2018
In Control 3, the CV remains positive at 9,000 EU, indicating cost savings. However, the SV is negative at -24,600 EU across all levels, aligning with the observed delay in the Gantt chart.
The EVM chart visualizes this: the Actual Cost line (yellow) trails below the EV (green), confirming the positive CV. Conversely, the PV (blue line) surpasses the EV, signifying the negative SV.


Figure 12. Control 2
Control 4. 4/1/2019
In Control 4, Activities 5 and 8 exhibit negative Cost Variances (CV). However, the overall project maintains a positive CV due to the favorable performance of Activities 1, 2, and 7.
Regarding Schedule Variance (SV), a delay of 16,500 units (assuming EU refers to Earned Units) is observed, indicating a continuation of the delay encountered in previous control periods.


Figure 13. Control 3
Control 5. 11/01/2019
Control 5 maintained the same comment structure as previous controls, with positive values in the Cost Variance (CV) indicating cost reductions and negative values in the Schedule Variance (SV) signifying time delays.
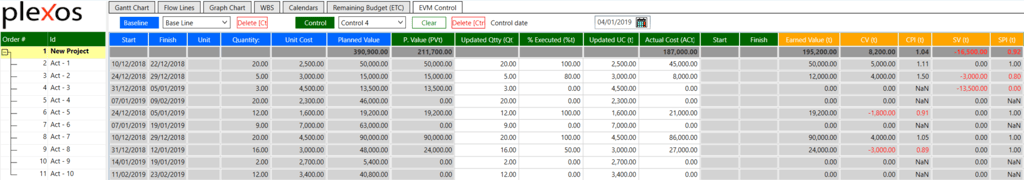

Figure 14. Control 4
Control 6. 18/01/2019
At the sixth control point, only two activities remain to be completed. The project is currently experiencing a schedule variance (SV) of approximately two weeks, indicating a delay. However, the cost variance (CV) remains positive, suggesting that the project is currently under budget.

Figure 15. Control 5
Final comments
This example shows a conceptual application of Earned Value Management (EVM) with Plexos, highlighting its significant advantages while acknowledging its limitations and the necessary precautions for the accurate interpretation of EVM indices.
It's crucial to understand that controls within Plexos provide a snapshot of the project at a specific point in time. The initial values displayed in a control are derived from the project's properties panel. However, subsequent modifications to the properties panel will only be reflected in the 'Remaining Budget' field within the control itself.
To adjust the values displayed in a specific control, users can directly modify the corresponding fields within that control. These modifications will not alter the values in the properties panel or the 'Remaining Budget' field.
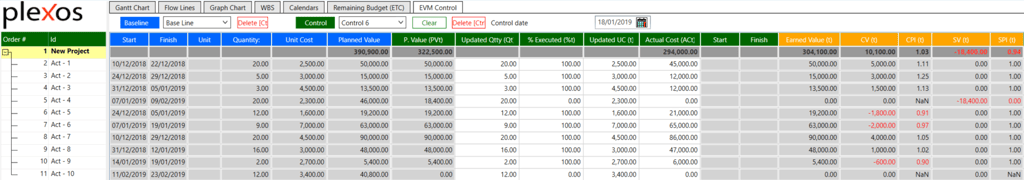

Figure 16. Control 6
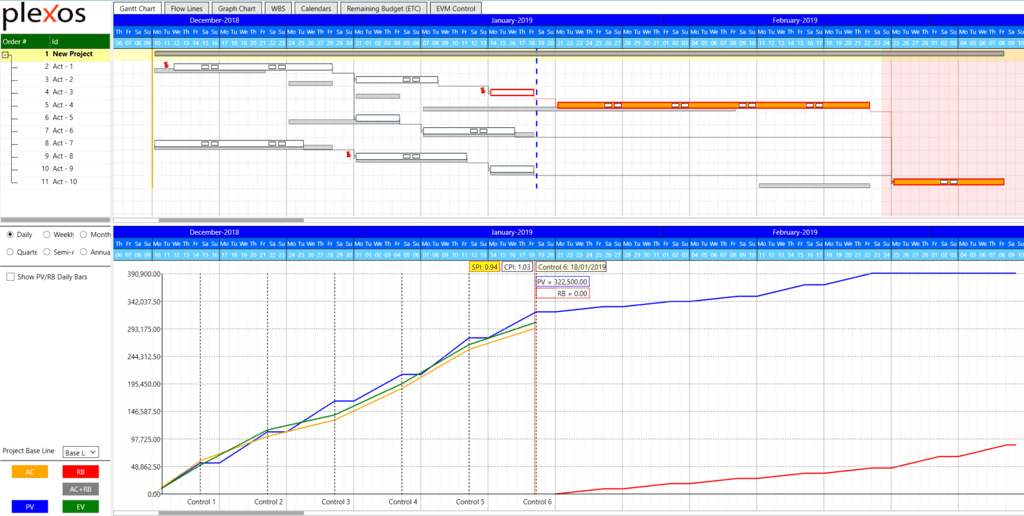
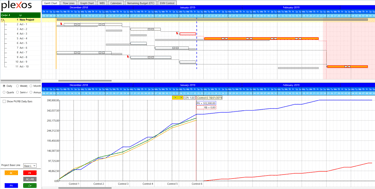
Figure 17. Gantt chart and S-curves at control 6
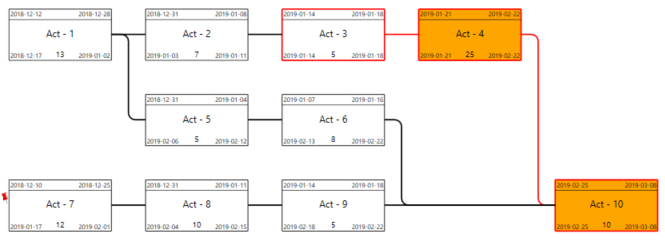
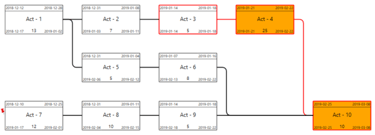
Figure 18. Project Planned Graph at control 6
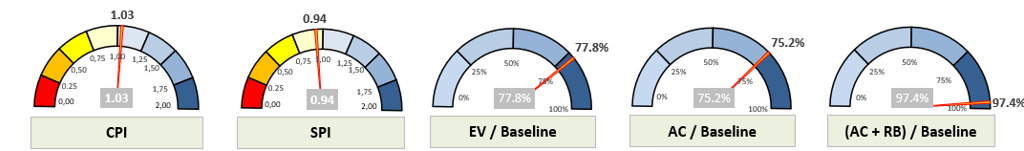
Figure 19. Excel Report: Control KPIs
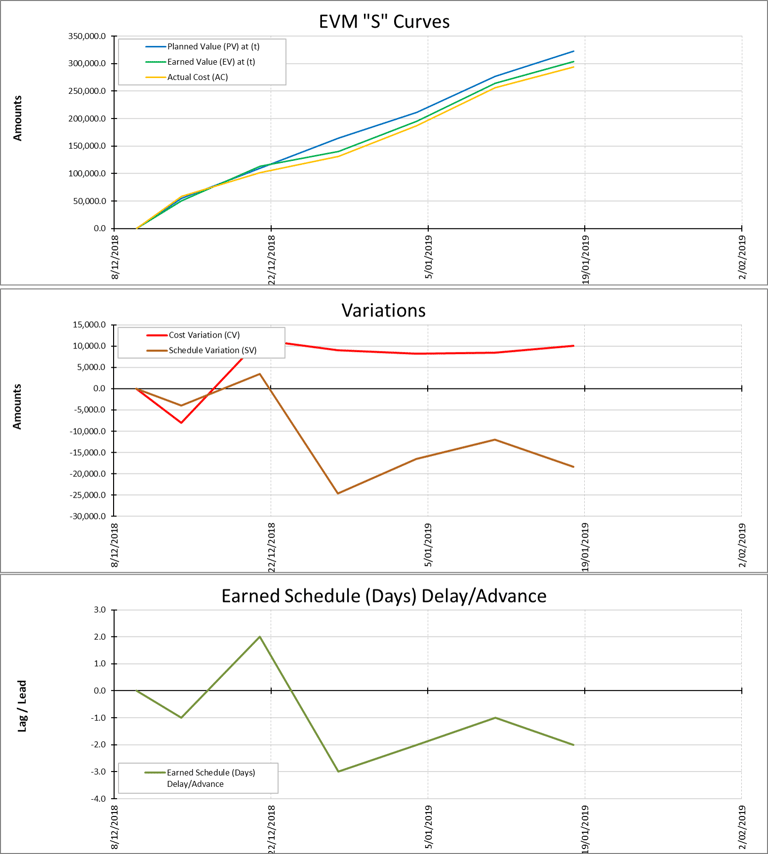
Figure 20. Excel Report: Project control S-curves
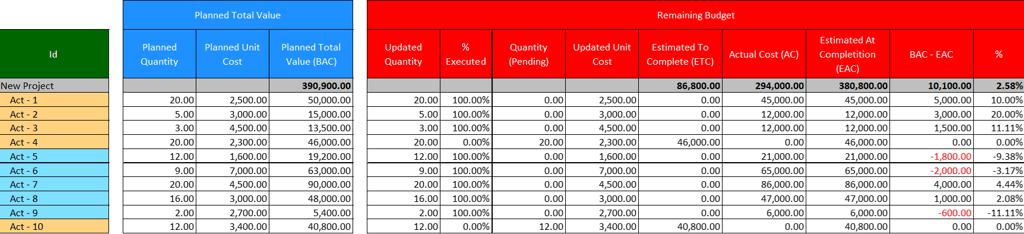
Figure 21. Excel Report: Control Summary

Figure 1. Planned Quantity (PQ) in EVM Panel